

Ending 2025 on a positive note
December closed the year with constructive macroeconomic backdrop; inflation, labor market dynamics, and shifting expectations for Federal Reserve policy have shaped a positive tone for markets heading into 2026.
While Inflation data was incomplete due to the government shutdown, data showed further signs of cooling. Both headline and core measures continued to drift lower, as illustrated by the Cleveland and NY Fed measures in the chart to the left. Core PCE remains above the Federal reserve target of 2%, but the overall trend has reinforced the view that the Fed’s tightening cycle has largely achieved its objective. Market‑based inflation expectations (3-yr breakeven) moved lower, reflecting confidence that the Fed is on the right path.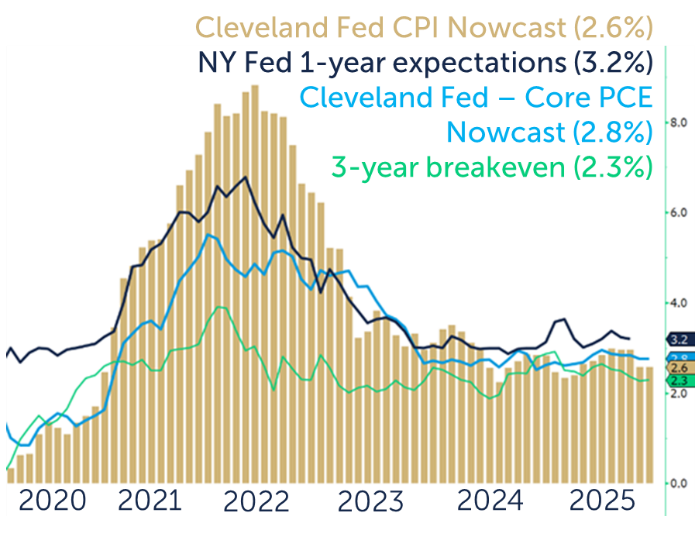
Labor market indicators pointed to a gradual softening rather than a sharp downturn. Payroll growth slowed, job openings continued to decline, and wage gains moderated from earlier peaks. Weekly jobless claims remained relatively low but trended upward, consistent with a cooling—but still resilient—employment environment.
This combination of easing inflation and a softening labor market strengthened expectations that the Fed will continue cutting rates in 2026, supporting the stock market. Economic activity remained mixed but generally stable: Consumer spending held up reasonably well, though with clear divergence between higher‑income households and more budget‑constrained consumers. Manufacturing surveys stayed in contraction territory, while services activity remained expansionary. Housing showed signs of improvement as mortgage rates eased from their highs, offering some relief to prospective buyers.
Financial markets responded positively to the macro backdrop. Equities extended their year‑end rally as investors priced in a more accommodative policy path and a soft‑landing scenario. Bond yields declined across the curve, reflecting both easing inflation and expectations for future rate cuts. Volatility remained subdued, though history suggests that such calm can precede more meaningful market moves.
As we enter the new year, the interplay between inflation, employment, and monetary policy will remain central to the outlook. Before turning to how these dynamics shape our positioning for 2026, it’s helpful to review how December’s macro trends set the stage for the year ahead.
December Market Review
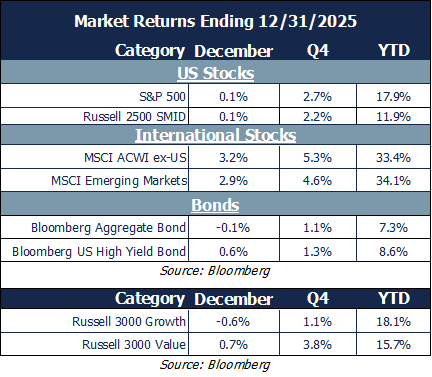
Non-US Stocks shone brightest in December :
- International and emerging market stocks led the way for the month, continuing the 2025 trend and ending the year with 30% gains.
- US stocks were stagnant, reflecting uncertainty over future Fed rate cuts and the US economy. The S&P 500 returned 17.9% for the year however and, remarkably, ended the year 37% higher than the April 8 ‘Liberation Day’ low.
- High grade bonds were down slightly and turned in a full-year performance in 2025 that was a couple percent greater than starting yields as rates dropped throughout the year.
Sector performance showed some notable shifts:
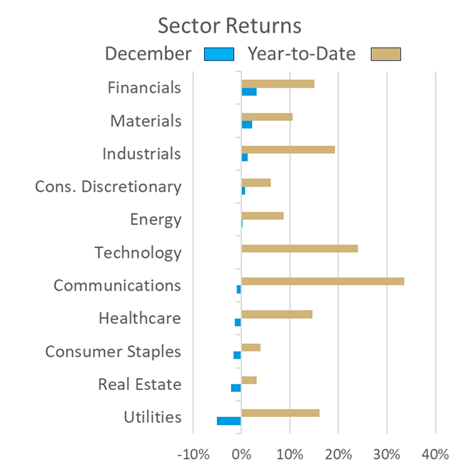
- Financials and materials were the strongest sectors in the month as the market rotated in favor of value rather than growth.
- Utilities, however, bucked the value trend as reduced expectations for the AI data-center boom led to profit-taking
- Real Estate dropped as persistent office sector weakness and a cooling residential market converged to outweigh AI-driven positives.
- Technology was flat on the month, ending the year up 24% while communications returned 34% for the year. Notably, only two of the Mag 7 stocks outperformed the S&P 500. This serves as a welcome development and suggests that the broadening trend may continue.
Our Navigator framework informs our outlook.
January 2026 Navigator Outlook
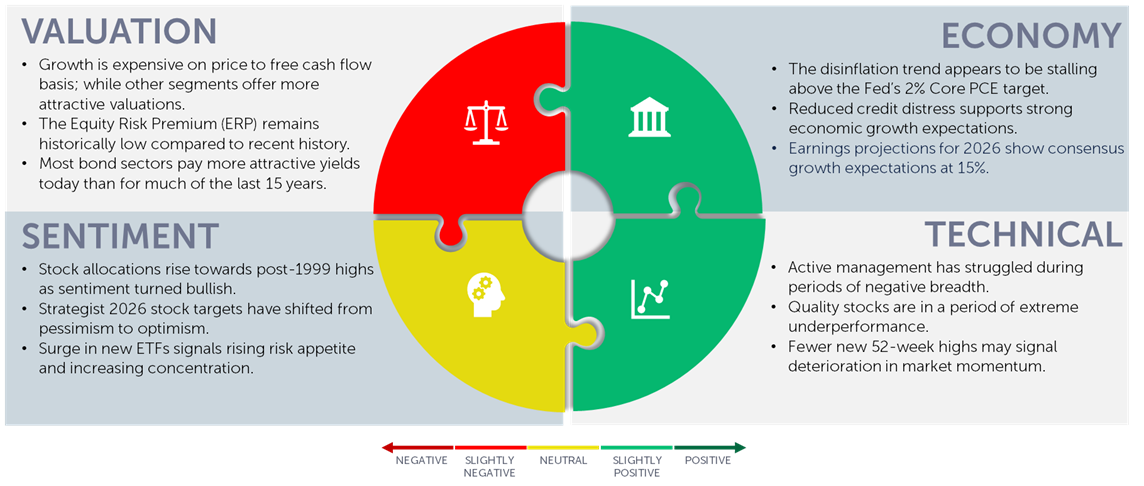
Economy: The disinflation trend of the last couple of years appears to be stalling above the Fed’s 2% Core PCE target. Reduced credit distress supports strong economic growth expectations; The consensus expects S&P 500 earnings to grow 15% in 2026.
Technicals: Active management has struggled during weak breadth, such as during the recent AI-focused environment. High quality stocks are also in a period of extreme underperformance. Fewer new 52-week highs may signal deterioration in the current positive long-term market momentum.
Sentiment: Stock allocations have risen towards post-1999 highs as sentiment turned bullish in December. Strategist 2026 stock targets have also shifted from pessimism to optimism since the April lows. A surge in new ETFs may signal rising risk appetite alongside continued concentration.
Valuation: Growth is expensive based on free cash flow measures; while other segments offer more attractive valuations. The Equity Risk Premium (ERP) remains low compared to recent history. Most bond sectors pay more attractive yields today than they have for much of the last 15 years.
Outlook and Recommendations: Winning in 2026 may not be pretty
The Carolina Panthers made history this NFL season by making the playoffs despite a losing record – for the second time. This has happened 5 times in the last 15 years, and two of those were the panthers (2014 as well as this year). While making the playoffs was a successful outcome, the ups and downs of the regular season didn’t feel great most of the time. The 2026 investing environment may feel similar, and success may not look the way it has looked in recent years – after three straight years of 20% or greater S&P 500 returns, we’re unlikely to see a fourth. Rather than laying out a forecast and presenting the risks, we will focus on the long-term fundamentals; the portfolio construction process will lead us to invest in a variety of compelling opportunities while minimizing the potential for loss.
Bonds may not see a repeat of their strong 2026 returns, as the Fed appears to be contending with internal conflict over its policy stance. Regardless of the path of rates in 2026, many sectors of the bond market provide compelling value.
Investment grade bonds – Treasury, Corporate and Mortgage bonds all offer higher yields than their average of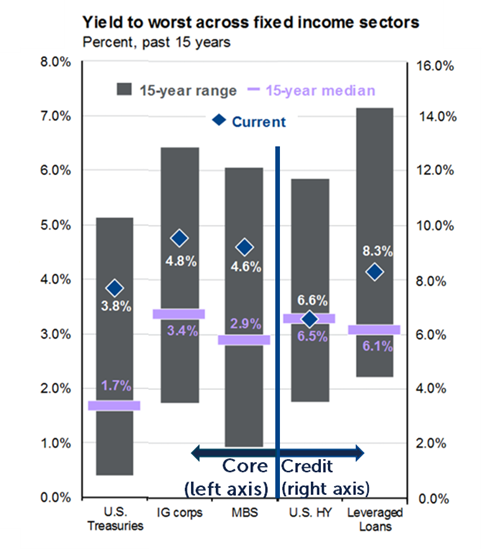 the last fifteen years, and pay significantly more than both current and expected inflation. They offer an attractive alternative to risky assets.
Credit-oriented sectors present a mixed opportunity set. While leveraged loans (as well as many private credit strategies) are paying high rates of return, traditional high yield bonds offer relatively modest yields, given their risk profile. The income premium relative to investment grade bonds is near all-time lows; you may not be getting compensated for the riskier loan profile. Corporate defaults are low, however, and If the economy avoids recession companies should be able to service their debt.
The economic outlook remains constructive, and the stock market is in a long-term up-trend. But investor equity allocations are near all-time highs and, by most measures, stocks – particularly US large cap stocks – are expensive, suggesting modest forward returns.
The chart to the right, produced as part of the OneAscent Capital Markets Assumptions process, illustrates this reality.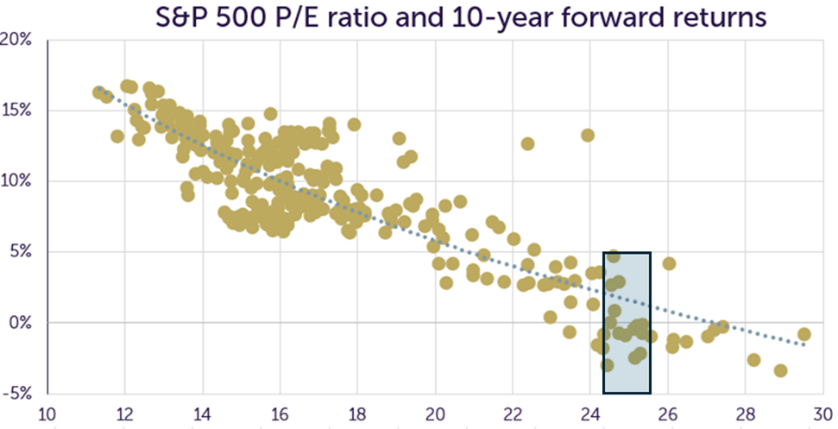 At today’s 25x trailing PE ratio, the next ten years are likely to produce returns that are well below historical averages. Valuation is a notoriously poor predictor of shorter term returns, and we aren’t predicting good or bad stock returns in 2026. But earnings growth, rather than valuation expansion, is likely to drive returns.
The chart below may help us identify opportunities; the graphic breaks out the technology sector alongside the broader large, mid and small-cap markets. While technology stocks are pulling large cap valuations higher – almost double the valuations of ten years ago – there are opportunities across the universe of mid and small cap stocks, which trade about the same level of valuation as they have for the last decade.
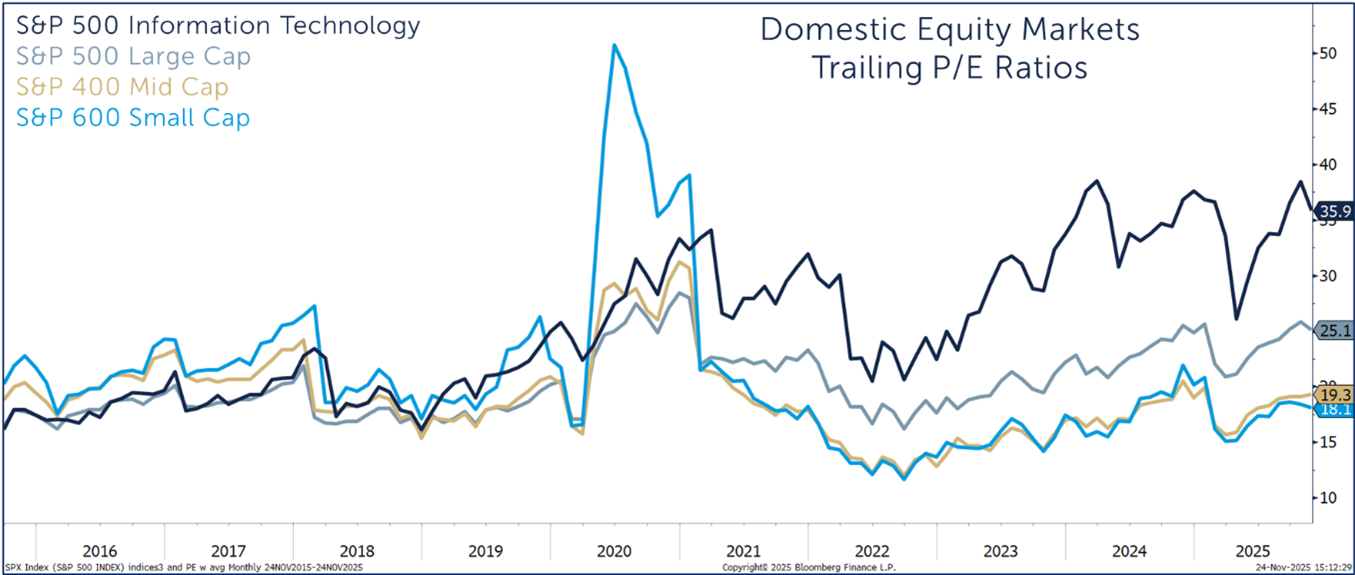
Likewise, international stocks still trade at a significant discount to US stocks despite significant outperformance in 2025. International and US stocks traded at almost the same valuation for a decade, from 2006 through 2015, but the international discount to US stocks has now grown to over 35% due to US outperformance during the last decade . Just over 30% of S&P members are currently beating the index, a level only seen during the tech bubble in the last 50 years.
The next few years may see a broadening of market performance: mid cap, small cap, International and Emerging Market stocks may have better returns than they have experienced in recent years – both on an absolute basis and relative to the S&P 500.
2026 may be, to revisit the football analogy, a year of struggling through the ups and downs to find success wherever it can be found. Another lesson that may guide 2026 comes from the sporting arena: the maxim that ‘defense wins championships’. This is analogous to the idea that investments is a ‘losers game’, where winning means making fewer mistakes. The key to winning in 2026 will be to make fewer mistakes and, in some areas, to play defense; this is how we are approaching portfolio construction.
Portfolio Construction and Positioning
We have outlined a positive economic and technical backdrop alongside the extremely high valuations in some areas of the market, and investor positioning which leaves little room for increased equity purchases. Our Navigator process helps guides both short- and long-term portfolio allocations. Below we share our positioning and highlight risks that each allocation is intended to help mitigate:
- Mid-caps, value, dividend stocks and international equities: These segments continue to offer attractive valuations relative to U.S. large cap growth and the market may finally be waking up to their long-term potential. Investing in these sectors helps mitigate the risk of high valuations, particularly in the S&P 500.
- Balanced exposure across styles: We maintain a mix of growth stocks poised to benefit from technological innovation and value stocks offering upside potential and, in many cases, strong dividend profiles. This helps mitigate the risk of concentrated performance in the market leaders of the last couple of years.
- Fixed income remains compelling: Bond yields exceed the earnings yield of large-cap equities, and real (inflation-adjusted) yields are positive—supporting the case for continued fixed income exposure. Fixed income allocations help mitigate volatility risk, which is heightened due to current low levels of bond and stock volatility.
- Mortgage-backed securities: We see favorable risk-reward dynamics here, though tight corporate credit spreads warrant caution. This helps mitigate risk of tight corporate bond spreads as well as the risk that inflation may increase. We are investing in credit through structured vehicles and areas with lower correlation to traditional high yield bonds.
- Alternative investments: We continue to find meaningful opportunities in both non-correlated strategies and private market investments. Alternative investments may help mitigate a variety of risks, including macroeconomic, government policy mistakes, and geopolitical
Our goal is to build portfolios that are resilient and capable of compounding effectively over time. We are mindful of risks to the outlook remain focused on the value of discipline and diversification.
This material is intended to be educational in nature, and not as a recommendation of any particular strategy, approach, product or concept for any particular advisor or client. These materials are not intended as any form of substitute for individualized investment advice. The discussion is general in nature, and therefore not intended to recommend or endorse any asset class, security, or technical aspect of any security for the purpose of allowing a reader to use the approach on their own. Before participating in any investment program or making any investment, clients as well as all other readers are encouraged to consult with their own professional advisers, including investment advisers and tax advisors. OneAscent can assist in determining a suitable investment approach for a given individual, which may or may not closely resemble the strategies outlined herein.
Source: Bloomberg, Cleveland Fed, NY Fed. Cleveland Fed CPI and Core PCE nowcast: Inflation Nowcasting NY Fed Surve of Consumer expectations: Survey of Consumer Expectations – FEDERAL RESERVE BANK of NEW YORK, Inflation breakeven
Source: Bloomberg, FactSet, J.P. Morgan Credit Research, J.P. Morgan Asset Management. Indices used are Bloomberg except for ABS, emerging market debt and leveraged loans: ABS: J.P. Morgan ABS Index; CMBS: Bloomberg Investment Grade CMBS Index; EMD (USD): J.P. Morgan EMIGLOBAL Diversified Index; EMD (LCL): J.P. Morgan GBI-EM Global Diversified Index; EM Corp.: J.P. Morgan CEMBI Broad Diversified; Leveraged Loans: JPM Leveraged Loan Index; Euro IG: Bloomberg Euro Aggregate Corporate Index; Euro HY: Bloomberg Pan-European High Yield Index. Yield to worst is the lowest possible yield that can be received on a bond apart from the company defaulting and considers factors like call provisions, prepayments and other features that may affect the bonds’ cash flows. ABS data begins in 2012. *All sectors shown are yield to worst except for Municipals, which is based on the tax-equivalent yield to worst assuming a top income tax bracket rate of 37% plus a Medicare tax rate of 3.8%. JP Morgan Guide to the Markets – U.S. Data are as of December 18, 2025.
Source: OneAscent Investment Solutions, Bloomberg
Source: Market Returns reference the following indices: Large Cap – S&P 500, Mid Cap Growth – Russell Midcap growth, Mid Cap Value – Russell Midcap Value, Small Cap – Russell 2000, Developed – MSCI EAFE, Emerging – MSCI Emerging Markets, Aggregate – Bloomberg US Aggregate, High Yield – Bloomberg High Yield
OAI01421